Sensors By Spatial Resolution
Greater than 1 km
- AATSR -- ERS-2
- ATSR -- ERS-1
- AVHRR -- NOAA POES
- AVHRR/3 -- MetOp
- GOES Imager -- GOES
- POLDER 1-2 -- ADEOS 1-2
- SEVIRI --Meteosat Second Generation
- Vegetation -- SPOT 4-5
- VIRS -- TRMM
10m - 1km
- ASTER -- Terra
- AWiFS -- IRS ResourceSat 1-2
- CCD -- CBERS 1-2
- DMC -- DMC
- ETM+ -- Landsat7
- IR-MSS --CBERS 1-2
- LISS -- IRS 1A-1D
- MSS -- Landsat 1-5
- RBV -- Landsat 1-2
- TM -- Landsat 4-5
Less Than 10m
- AVNIR -- ADEOS
- AVNIR-2 -- ALOS
- Cartosat-2 -- Cartosat-2
- EROS-A/B -- EROS-A/B
- HRG -- SPOT5
- HRV -- SPOT 1-3
- HRVIR -- SPOT 4
- IKONOS -- IKONOS
- LISS -- IRS ResourceSat 1-2
- OrbView-3 -- Orbview-3
- Quickbird -- Quickbird
- RapidEye -- RapidEye
- RSI -- FORMOSAT-2
- WorldView-1 -- WorldView-1
Active Sensors
- AMI -- ERS-1 and 2
- AMSR-E -- Aqua
- ASAR -- ENVISAT
- PALSAR -- ALOS
- Radarsat -- Radarsat-1,2
- SSM/I -- DMSP
Planned Sensors
- ERO -- Sentinel-1
- IR-MSS -- CBERS 3-4
- MultiSpectral -- TWSAT
- MUX -- CBERS 3-4
- OHRM -- Sentinel-2
- OLI -- LDCM
- PAN -- CBERS 3-4
- SAR -- RISAT-1
- VIIRS -- NPOESS
- WFI -- CBERS 3-4
April 17, 2011
April 08, 2011
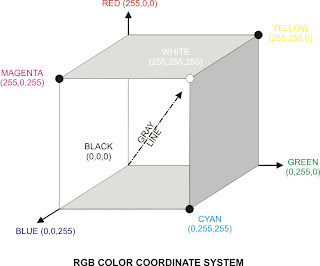
RGB color coordinate system
Digital remote sensor data are usually displayed using a Red-Green-Blue (RGB)
color coordinate system, which is based on additive color theory and the three
primary colors of red, green and blue. Additive color theory is based on what
happens when light is mixed, rather than when pigments are mixed using
subtractive color theory.
For example, in additive color theory a pixel having RGB
values of 255,255,255 produces a bright pixel.
Conversely, we would get a dark pigment if we mixed equally high proportions of
blue, green and red paint (subtractive color theory).
Using three 8-bit image and additive color theory, we can conceivably
display 224=16,777,216 color combinations.
For example, RGB brightness value of 255,255,0 would yield a bright yellow pixel
and RGB brightness values of 255,0,0 would produce a bright red pixel. RGB values
of 0,0,0 yield a black pixel.
Grays are produced along the gray line in the RGB color coordinate system when
equal proportions of blue, green and red are encountered
(e.g., an RGB of 127,127,127 produces a medium-gray pixel on the screen or
hard-copy device).
Jensen John R. 2005. Introductory Digital Image processing-A Remote Sensing Perspective. 3rd edition. chapter 5. Pearson Prentice Hall.
Labels:
color coordinate system,
RGB
April 06, 2011
DIGITAL IMAGE DATA FORMATS
DIGITAL IMAGE DATA FORMATS
The image analyst can order digital remote sensor data in a variety of formats.
The most common formats are :
- Band Interleaved by Pixel (BIP),
- Band Interleaved by Line (BIL), and
- Band Sequential (BSQ).
To appreciate the data formats, consider a hypothetical remote sensing dataset containing
just nine pixels obtained over the interface between land and water. The Image consists
of three bands (band 1=green;band 2=red;band 3=near-infrared).
The brightness value (BVi,j,k) row, column, and band notation is provided (figure 1a).
Band Interleaved by Pixel (BIP) Format
The BIP format places the brightness values in n bands associated with each pixel in the dataset in sequential order [e.g., for a dataset containing three bands the format for the first pixel in the matrix (1,1) is 1,1,1; 1,1,2; 1,1,3]. The brightness values for pixel (1,2) are then placed in the dataset (e.g., 1,2,1; 1,2,2; and 1,2,3), and so on. An end-of-file (EOF) marker is placed at the end of the dataset (figure 1b).
Band Interleaved by Line (BIL) Format
The BIL format creates a file that places the brightness values in n bands assocciated with each line in the dataset in sequential order. For example, if are three bands in the dataset, all of the pixels in line 1, band 2, and the then line 1, band 3. An EOF marker is placed at the end of the dataset (figure 1c).
Band Sequential (BSQ) Formats
The BSQ format places all of the individual pixel values in each band in a separate and unique file. Each band has its own beginning header record and EOF marker (figure 1d).
The BSQ format places all of the individual pixel values in each band in a separate and unique file. Each band has its own beginning header record and EOF marker (figure 1d).
Labels:
data,
digital image


