Sensors By Spatial Resolution
Greater than 1 km
- AATSR -- ERS-2
- ATSR -- ERS-1
- AVHRR -- NOAA POES
- AVHRR/3 -- MetOp
- GOES Imager -- GOES
- POLDER 1-2 -- ADEOS 1-2
- SEVIRI --Meteosat Second Generation
- Vegetation -- SPOT 4-5
- VIRS -- TRMM
10m - 1km
- ASTER -- Terra
- AWiFS -- IRS ResourceSat 1-2
- CCD -- CBERS 1-2
- DMC -- DMC
- ETM+ -- Landsat7
- IR-MSS --CBERS 1-2
- LISS -- IRS 1A-1D
- MSS -- Landsat 1-5
- RBV -- Landsat 1-2
- TM -- Landsat 4-5
Less Than 10m
- AVNIR -- ADEOS
- AVNIR-2 -- ALOS
- Cartosat-2 -- Cartosat-2
- EROS-A/B -- EROS-A/B
- HRG -- SPOT5
- HRV -- SPOT 1-3
- HRVIR -- SPOT 4
- IKONOS -- IKONOS
- LISS -- IRS ResourceSat 1-2
- OrbView-3 -- Orbview-3
- Quickbird -- Quickbird
- RapidEye -- RapidEye
- RSI -- FORMOSAT-2
- WorldView-1 -- WorldView-1
Active Sensors
- AMI -- ERS-1 and 2
- AMSR-E -- Aqua
- ASAR -- ENVISAT
- PALSAR -- ALOS
- Radarsat -- Radarsat-1,2
- SSM/I -- DMSP
Planned Sensors
- ERO -- Sentinel-1
- IR-MSS -- CBERS 3-4
- MultiSpectral -- TWSAT
- MUX -- CBERS 3-4
- OHRM -- Sentinel-2
- OLI -- LDCM
- PAN -- CBERS 3-4
- SAR -- RISAT-1
- VIIRS -- NPOESS
- WFI -- CBERS 3-4
April 17, 2011
April 08, 2011
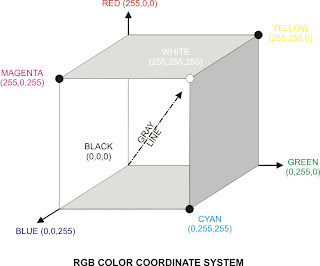
RGB color coordinate system
Digital remote sensor data are usually displayed using a Red-Green-Blue (RGB)
color coordinate system, which is based on additive color theory and the three
primary colors of red, green and blue. Additive color theory is based on what
happens when light is mixed, rather than when pigments are mixed using
subtractive color theory.
For example, in additive color theory a pixel having RGB
values of 255,255,255 produces a bright pixel.
Conversely, we would get a dark pigment if we mixed equally high proportions of
blue, green and red paint (subtractive color theory).
Using three 8-bit image and additive color theory, we can conceivably
display 224=16,777,216 color combinations.
For example, RGB brightness value of 255,255,0 would yield a bright yellow pixel
and RGB brightness values of 255,0,0 would produce a bright red pixel. RGB values
of 0,0,0 yield a black pixel.
Grays are produced along the gray line in the RGB color coordinate system when
equal proportions of blue, green and red are encountered
(e.g., an RGB of 127,127,127 produces a medium-gray pixel on the screen or
hard-copy device).
Jensen John R. 2005. Introductory Digital Image processing-A Remote Sensing Perspective. 3rd edition. chapter 5. Pearson Prentice Hall.
color coordinate system, which is based on additive color theory and the three
primary colors of red, green and blue. Additive color theory is based on what
happens when light is mixed, rather than when pigments are mixed using
subtractive color theory.
For example, in additive color theory a pixel having RGB
values of 255,255,255 produces a bright pixel.
Conversely, we would get a dark pigment if we mixed equally high proportions of
blue, green and red paint (subtractive color theory).
Using three 8-bit image and additive color theory, we can conceivably
display 224=16,777,216 color combinations.
For example, RGB brightness value of 255,255,0 would yield a bright yellow pixel
and RGB brightness values of 255,0,0 would produce a bright red pixel. RGB values
of 0,0,0 yield a black pixel.
Grays are produced along the gray line in the RGB color coordinate system when
equal proportions of blue, green and red are encountered
(e.g., an RGB of 127,127,127 produces a medium-gray pixel on the screen or
hard-copy device).

Jensen John R. 2005. Introductory Digital Image processing-A Remote Sensing Perspective. 3rd edition. chapter 5. Pearson Prentice Hall.
April 06, 2011
DIGITAL IMAGE DATA FORMATS
DIGITAL IMAGE DATA FORMATS
The image analyst can order digital remote sensor data in a variety of formats.
The most common formats are :
- Band Interleaved by Pixel (BIP),
- Band Interleaved by Line (BIL), and
- Band Sequential (BSQ).
To appreciate the data formats, consider a hypothetical remote sensing dataset containing
just nine pixels obtained over the interface between land and water. The Image consists
of three bands (band 1=green;band 2=red;band 3=near-infrared).
The brightness value (BVi,j,k) row, column, and band notation is provided (figure 1a).
Band Interleaved by Pixel (BIP) Format
The BIP format places the brightness values in n bands associated with each pixel in the dataset in sequential order [e.g., for a dataset containing three bands the format for the first pixel in the matrix (1,1) is 1,1,1; 1,1,2; 1,1,3]. The brightness values for pixel (1,2) are then placed in the dataset (e.g., 1,2,1; 1,2,2; and 1,2,3), and so on. An end-of-file (EOF) marker is placed at the end of the dataset (figure 1b).
Band Interleaved by Line (BIL) Format
The BIL format creates a file that places the brightness values in n bands assocciated with each line in the dataset in sequential order. For example, if are three bands in the dataset, all of the pixels in line 1, band 2, and the then line 1, band 3. An EOF marker is placed at the end of the dataset (figure 1c).
Band Sequential (BSQ) Formats
The BSQ format places all of the individual pixel values in each band in a separate and unique file. Each band has its own beginning header record and EOF marker (figure 1d).
The BSQ format places all of the individual pixel values in each band in a separate and unique file. Each band has its own beginning header record and EOF marker (figure 1d).

February 20, 2011
Merekam ArcMap Project (*.mxd) ke CD/DVD/USB Flashdisk
Jika anda ingin mengopi sebuah project ArcMap (*.mxd) ke media lain, maka anda membutuhkan script MXDPackager.
Syaratnya, semua file layer atau shp dan project diletakkan dalam satu folder. Jadi, nantinya anda hanya mengopi foldernya saja ke media lain.
MXDPackager merupakan sebuah script untuk merekam ArcMap project (*.mxd)
ke dalam USB Flashdisk/CD/DVD dan tersedia dalam format *.bas
Berikut langkah-langkahnya:
1. Extract MXDPackager. Nama file hasil extract adalah PackageMXD end.bas
2. Buka ArcMap project (*.mxd) yang ingin Anda copy ke USB Flashdisk/CD/DVD
3. Kemudian klik menu Tools - Macros - Visual Basic Editor .

4. Pada jendela Project di sebelah kiri tampilan Visual Basic Editor, klik
kanan pada Project (nama file ArcMap project.mxd), lalu pilih Import File.

5. Browse pada file PackageMXD end.bas klik Open
6 .Di bawah Project (nama file ArcMap project.mxd) kini tersedia folder
Modules dan di dalamnya terdapat PackageMXD.
7. Double klik PackageMXD, sehingga script-nya akan tampil.
lalu klik Run atau tekan F5.

8. Browse folder untuk menyimpan hasil kerja MXDPackager. Klik OK

9. Muncul jendela yang menanyakan, apakah Anda ingin menyimpan seluruh
layer (klik Yes) atau seluruh layer di clip sesuai dengan dataframenya (No)

10. Jika Anda klik Yes, akan muncul jendela kecil berikutnya yang menanyakan,
apakah Anda ingin menyimpan seluruh layer baik yang visible maupun
invisible (Yes) atau hanya yang visible saja (No)

Download MXDPackager
Syaratnya, semua file layer atau shp dan project diletakkan dalam satu folder. Jadi, nantinya anda hanya mengopi foldernya saja ke media lain.
MXDPackager merupakan sebuah script untuk merekam ArcMap project (*.mxd)
ke dalam USB Flashdisk/CD/DVD dan tersedia dalam format *.bas
Berikut langkah-langkahnya:
1. Extract MXDPackager. Nama file hasil extract adalah PackageMXD end.bas
2. Buka ArcMap project (*.mxd) yang ingin Anda copy ke USB Flashdisk/CD/DVD
3. Kemudian klik menu Tools - Macros - Visual Basic Editor .

4. Pada jendela Project di sebelah kiri tampilan Visual Basic Editor, klik
kanan pada Project (nama file ArcMap project.mxd), lalu pilih Import File.

5. Browse pada file PackageMXD end.bas klik Open
6 .Di bawah Project (nama file ArcMap project.mxd) kini tersedia folder
Modules dan di dalamnya terdapat PackageMXD.
7. Double klik PackageMXD, sehingga script-nya akan tampil.
lalu klik Run atau tekan F5.

8. Browse folder untuk menyimpan hasil kerja MXDPackager. Klik OK

9. Muncul jendela yang menanyakan, apakah Anda ingin menyimpan seluruh
layer (klik Yes) atau seluruh layer di clip sesuai dengan dataframenya (No)

10. Jika Anda klik Yes, akan muncul jendela kecil berikutnya yang menanyakan,
apakah Anda ingin menyimpan seluruh layer baik yang visible maupun
invisible (Yes) atau hanya yang visible saja (No)
Download MXDPackager
February 17, 2011
IMAGE CLASSIFICATION EXERCISE USING ILWIS 3.3
1. Open ILWIS software by double clicking the ILWIS icon on the desktop, and
you will see the following opening menu. In this opening menu, click the open
file icon, so that you can select a folder named DATA_ILWIS in C:\ drive, or any
other folder name specified by your instructor. As you can see here, there is no
file available for working.
However, actually there is an image dataset prepared for your exercise,
although it is stored in ERDAS 7.* format (*.lan)
Author by : Projo Danoedoro
download here
February 13, 2011
Aligning Themes in a View
Aligning raster data with unprojected vector data in a view
If grids or images you are using have been projected in a package such as ARC/INFO,
they can be aligned with vector data in decimal degrees. Since the grid or image does not
project in ArcView, simply project the view. The unprojected vector data will project to
align with the raster data.
To align your raster and vector data :
1. Determine the projection parameters used when your image or grid was projected.
For grids, this information appears in its prj file. For images, check any available metadata
files.
2. Add the image or grid to a view. Also add the unprojected vector decimal degree data.
3. From View Properties, select Projection to display the Projection Properties dialog box.
4. Set the view’s map projection to match the parameters of the grid or image. If the
parameters of the projection do not match those of ArcView’s standard projections,
try using a custom projection. Use the table below as a guide.
5. Click OK on the Projection Properties dialog box.
6. From View Properties, set the Map Units of the view to match the projected units
of your image or grid. For example, if your image is projected to State Plane feet,
set the Map Units to feet.
7. Click OK on the View Properties dialog box. ArcView redraws the view using the
projection you chose, and your themes should align.


