Apakah anda tahu bahwa setidaknya ada ratusan indeks spektral lainnya selain NDVI (Normalized Difference Vegetation Index), yang banyak digunakan untuk menganalisis vegetasi?
Pada dasarnya setiap indeks spektral merupakan kombinasi tertentu (formula) dari sifat pantulan yang diukur sensor (kadar air, kandungan klorofil, pigmen, dll.) pada 2 atau lebih panjang gelombang yang mengungkapkan karakteristik vegetasi tertentu. Seiring kemajuan sensor, satelit pengamatan bumi menyediakan data baru kepada para ahli penginderaan jauh untuk mendorong penelitian mereka dan meningkatkan analisis yang ada.
Setiap indeks memiliki keterbatasannya. NDVI peka terhadap efek tanah dan atmosfer, oleh karena itu direkomendasikan untuk menerapkan indeks tambahan untuk analisis vegetasi yang lebih akurat.
SAVI
Apa itu indeks SAVI (Soil Adjusted Vegetation Index) ? SAVI dirancang untuk meminimalkan pengaruh kecerahan tanah. Huete sang pengembangnya menambahkan faktor L (kesesuaian tanah) ke persamaan NDVI untuk memperbaiki efek kebisingan tanah (warna tanah, kelembaban tanah, variabilitas tanah di seluruh wilayah, dll.) yang cenderung berdampak pada hasil.
September 25, 2019

September 23, 2019
Menggabungkan Band (Layer Stacking) Citra Sentinel-2
Citra Sentinel-2 yang di download mempunyai format file *.jp2. Format tersebut dapat diubah menjadi *.geotiff. Untuk mengubah format file dapat menggunakan software gratis pengolah data raster besutan European Space Agency (ESA) yang dapat diunduh gratis di situs ESA SNAP. Ada cara lainnya yaitu menggunakan QGIS yang telah terinstal plugin SCP. Kali ini akan dibahas bagaimana resampling citra di software SNAP dan menggabungkan band (stacking) menggunakan software ENVI. Langkah-langkahnya sebagai berikut :
1. Buka program SNAP
2. Untuk mengkonvert menjadi format *.Geotiff, klik Raster -> Geometric Operations ->
Resampling
3. Muncul jendela Resampling. Pilih folder IMG_DATA

1. Buka program SNAP
2. Untuk mengkonvert menjadi format *.Geotiff, klik Raster -> Geometric Operations ->
Resampling
3. Muncul jendela Resampling. Pilih folder IMG_DATA

September 22, 2019
China Meluncurkan Satelit Penginderaan Jauh yang Baru

Satelit tersebut milik proyek konstelasi satelit penginderaan jauh komersial "Zhuhai-1," yang akan terdiri dari 34 satelit mikro-nano, termasuk video, hiperspektral, dan satelit optik resolusi tinggi, radar dan inframerah. Roket pengangkutnya dikembangkan oleh Akademi Peluncuran Teknologi Kendaraan China, dan satelit diproduksi oleh Institut Teknologi Harbin dan dioperasikan oleh Zhuhai Orbita Aerospace Science and Technology Co. Ltd. Peluncuran hari Kamis lalu adalah misi ke-311 untuk roket pembawa seri Long March.
Satelit yang baru diluncurkan ini terdiri dari empat satelit hiperspektral dengan 256 panjang gelombang dan lebar jangkauan 150 km, dan satelit video dengan resolusi 90 cm. Satelit Zhuhai-1 hiperspektral memiliki resolusi spasial tertinggi dan lebar cakupan terbesar dari jenisnya di Cina.
Data tersebut akan digunakan untuk analisis kuantitatif yang akurat mengenai vegetasi, air dan tanaman, dan akan menyediakan layanan untuk membangun smart cities, kata Orbita, operator swasta terbesar dari satelit hiperspektral di orbit.
Perusahaan ini bertujuan untuk bekerja sama dengan organisasi dan perusahaan milik pemerintah untuk memperluas layanan satelit big data.
Sumber
September 20, 2019
Resize Ukuran Gambar Menggunakan FastStone Photo Resizer
Foto udara hasil perekaman drone biasanya dalam format *.jpg. ukuran file sekitar 5 MB. File tersebut bisa diturunkan ukuran filenya menggunakan program penurun size gambar tanpa mengubah dimensi dan piksel. Salah satunya menggunakan FastStone yang tersdia free. Format yang didukung yaitu bmp, cur, gif, ico, jpg, jpeg, jpe, jp2, j2k, pcx, png, ppm, psd, eps, tga, tif, tiff, dan wmf. FastStone dapat dibuka disini. Output file dapat berupa jpg, bmp, gif, png, jp2, tif, dan pdf.
1. Buka program FastStone
2. Pada contoh berikut, digunakan format file jpg. Buka Folder tempat file gambar yang akan anda
eksekusi. Pilih filenya, klik tombol Add all jika ingin menambahakan semua file. Centang isian
rename jika ingin memberi file dengan nama baru agar file lama tidak ditimpa. Lihat gambar
dibawah.

3. Setelah itu pilih output format *.jpg
September 19, 2019
Shp Batas Desa Seluruh Wilayah Indonesia

September 18, 2019
Buku "Classification Methods for Remotely Sensed Data"

Content terdiri dari :
1. Remote Sensing in the Optical and Microwave Regions
2. Pattern Recognition Principles
3. Artificial Neural Networks
4. Support Vector Machines
5. Methods Based on Fuzzy Set Theory
6. Decision Trees
7. Texture Quantization
8. Modeling Context Using Markov Random Fields
9. Multisource Classification
Buku "Remote Sensing Image Fusion:

Struktur buku ini terdiri atas :
1. Sensors and Image Data Products
2. Quality Assessment of Fusion
3. Image Registration and Interpolation
4. Multiresolution Analysis for Image Fusion
5. Spectral Transforms for Multiband Image Fusion
6. Pansharpening of Multispectral Images
7. Pansharpening of Hyperspectral Images
8. Effects of Aliasing and Misalignments on Pansharpening
9. Fusion of Images from Heterogeneous Sensors
10. New Trends of Remote Sensing Image Fusion
May 01, 2012
Cropping Citra Menggunakan ENVI
ENVI merupakan salah satu software image processing yang banyak digunakan untuk pengolahan citra digital. Produk-produk ENVI ini adalah ENVI, IDL, PSG, E3De dan IAS.
Sebelum anda croping, citra dan file shp harus sama sistem proyeksi dan datumnya. Misalnya sama-sama proyeksi Geografis dan menggunakan datum WGS-84. Atau proyeksi UTM dan menggunakan datum WGS-84 dan pilih zona daerah anda.
Berikut ini proses cropping citra menggunakan ENVI...
1. Buka citra yang akan di croping. Setelah citra terbuka, pada jendela layer klik menu Overlay >>> Vectors... Setelah jendela Vector Parameter muncul, klik menu File >>> Open Vector Layer... Muncul jendela Selector Vector Filenames lalu pilih file yang akan dibuka. Pada format file, pilih shapefile [*.shp].
ENVI hanya mengolah file yang berformat *.evf. Oleh karena itu file shp tadi harus di konversi dahulu ke *.evf. Caranya yaitu pada jendela yang terbuka tadi, tentukan nama file dan tempat penyimpanannya pada pilihan Enter Output Filename [*.evf]. Kemudian klik OK.

Maka pada citra akan muncul file shp tadi yang tumpang tindih dengan citranya.

2. Pada jendela Vector Parameters, klik menu File >>> Export Active Layer to ROI's. Kemudian pilih Convert all records of an EVF layer to one ROI...

3. Pada menu utama ENVI, klik Basic Tools >>> Subset data via ROI. Pilih file citranya >>> OK

Sebelum anda croping, citra dan file shp harus sama sistem proyeksi dan datumnya. Misalnya sama-sama proyeksi Geografis dan menggunakan datum WGS-84. Atau proyeksi UTM dan menggunakan datum WGS-84 dan pilih zona daerah anda.
Berikut ini proses cropping citra menggunakan ENVI...
1. Buka citra yang akan di croping. Setelah citra terbuka, pada jendela layer klik menu Overlay >>> Vectors... Setelah jendela Vector Parameter muncul, klik menu File >>> Open Vector Layer... Muncul jendela Selector Vector Filenames lalu pilih file yang akan dibuka. Pada format file, pilih shapefile [*.shp].
ENVI hanya mengolah file yang berformat *.evf. Oleh karena itu file shp tadi harus di konversi dahulu ke *.evf. Caranya yaitu pada jendela yang terbuka tadi, tentukan nama file dan tempat penyimpanannya pada pilihan Enter Output Filename [*.evf]. Kemudian klik OK.

Maka pada citra akan muncul file shp tadi yang tumpang tindih dengan citranya.

2. Pada jendela Vector Parameters, klik menu File >>> Export Active Layer to ROI's. Kemudian pilih Convert all records of an EVF layer to one ROI...
3. Pada menu utama ENVI, klik Basic Tools >>> Subset data via ROI. Pilih file citranya >>> OK

April 29, 2012
Croping Citra Menggunakan File shp di Global Mapper
Croping Citra Menggunakan File shp di Global Mapper
Berikut ini cara cropping citra menggunakan file shp.
Contoh yang saya gunakan adalah ASTER GDEM2.
1. Pada program Global Mapper, buka citra dan file shp
[file shp yang digunakan harus polygon]

2. Klik icon feature info tool lalu klik pada file shp

3. Pada menu file, pilih Export Elevation Grid Format. Hal ini bertujuan agar citra hasil
cropping memiliki nilai elevasi seperti citra aslinya dan dapat dianalisis lebih lanjut.
 pilih DEM >>> OK
Berikut ini cara cropping citra menggunakan file shp.
Contoh yang saya gunakan adalah ASTER GDEM2.
1. Pada program Global Mapper, buka citra dan file shp
[file shp yang digunakan harus polygon]

2. Klik icon feature info tool lalu klik pada file shp

3. Pada menu file, pilih Export Elevation Grid Format. Hal ini bertujuan agar citra hasil
cropping memiliki nilai elevasi seperti citra aslinya dan dapat dianalisis lebih lanjut.

April 17, 2011
Sensors By Spatial Resolution
Sensors By Spatial Resolution
Greater than 1 km
- AATSR -- ERS-2
- ATSR -- ERS-1
- AVHRR -- NOAA POES
- AVHRR/3 -- MetOp
- GOES Imager -- GOES
- POLDER 1-2 -- ADEOS 1-2
- SEVIRI --Meteosat Second Generation
- Vegetation -- SPOT 4-5
- VIRS -- TRMM
10m - 1km
- ASTER -- Terra
- AWiFS -- IRS ResourceSat 1-2
- CCD -- CBERS 1-2
- DMC -- DMC
- ETM+ -- Landsat7
- IR-MSS --CBERS 1-2
- LISS -- IRS 1A-1D
- MSS -- Landsat 1-5
- RBV -- Landsat 1-2
- TM -- Landsat 4-5
Less Than 10m
- AVNIR -- ADEOS
- AVNIR-2 -- ALOS
- Cartosat-2 -- Cartosat-2
- EROS-A/B -- EROS-A/B
- HRG -- SPOT5
- HRV -- SPOT 1-3
- HRVIR -- SPOT 4
- IKONOS -- IKONOS
- LISS -- IRS ResourceSat 1-2
- OrbView-3 -- Orbview-3
- Quickbird -- Quickbird
- RapidEye -- RapidEye
- RSI -- FORMOSAT-2
- WorldView-1 -- WorldView-1
Active Sensors
- AMI -- ERS-1 and 2
- AMSR-E -- Aqua
- ASAR -- ENVISAT
- PALSAR -- ALOS
- Radarsat -- Radarsat-1,2
- SSM/I -- DMSP
Planned Sensors
- ERO -- Sentinel-1
- IR-MSS -- CBERS 3-4
- MultiSpectral -- TWSAT
- MUX -- CBERS 3-4
- OHRM -- Sentinel-2
- OLI -- LDCM
- PAN -- CBERS 3-4
- SAR -- RISAT-1
- VIIRS -- NPOESS
- WFI -- CBERS 3-4
Greater than 1 km
- AATSR -- ERS-2
- ATSR -- ERS-1
- AVHRR -- NOAA POES
- AVHRR/3 -- MetOp
- GOES Imager -- GOES
- POLDER 1-2 -- ADEOS 1-2
- SEVIRI --Meteosat Second Generation
- Vegetation -- SPOT 4-5
- VIRS -- TRMM
10m - 1km
- ASTER -- Terra
- AWiFS -- IRS ResourceSat 1-2
- CCD -- CBERS 1-2
- DMC -- DMC
- ETM+ -- Landsat7
- IR-MSS --CBERS 1-2
- LISS -- IRS 1A-1D
- MSS -- Landsat 1-5
- RBV -- Landsat 1-2
- TM -- Landsat 4-5
Less Than 10m
- AVNIR -- ADEOS
- AVNIR-2 -- ALOS
- Cartosat-2 -- Cartosat-2
- EROS-A/B -- EROS-A/B
- HRG -- SPOT5
- HRV -- SPOT 1-3
- HRVIR -- SPOT 4
- IKONOS -- IKONOS
- LISS -- IRS ResourceSat 1-2
- OrbView-3 -- Orbview-3
- Quickbird -- Quickbird
- RapidEye -- RapidEye
- RSI -- FORMOSAT-2
- WorldView-1 -- WorldView-1
Active Sensors
- AMI -- ERS-1 and 2
- AMSR-E -- Aqua
- ASAR -- ENVISAT
- PALSAR -- ALOS
- Radarsat -- Radarsat-1,2
- SSM/I -- DMSP
Planned Sensors
- ERO -- Sentinel-1
- IR-MSS -- CBERS 3-4
- MultiSpectral -- TWSAT
- MUX -- CBERS 3-4
- OHRM -- Sentinel-2
- OLI -- LDCM
- PAN -- CBERS 3-4
- SAR -- RISAT-1
- VIIRS -- NPOESS
- WFI -- CBERS 3-4
April 08, 2011
RGB color coordinate system
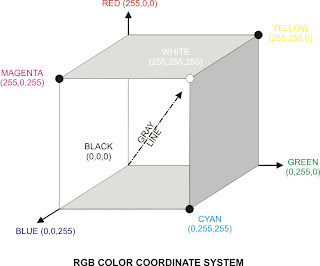
Digital remote sensor data are usually displayed using a Red-Green-Blue (RGB)
color coordinate system, which is based on additive color theory and the three
primary colors of red, green and blue. Additive color theory is based on what
happens when light is mixed, rather than when pigments are mixed using
subtractive color theory.
For example, in additive color theory a pixel having RGB
values of 255,255,255 produces a bright pixel.
Conversely, we would get a dark pigment if we mixed equally high proportions of
blue, green and red paint (subtractive color theory).
Using three 8-bit image and additive color theory, we can conceivably
display 224=16,777,216 color combinations.
For example, RGB brightness value of 255,255,0 would yield a bright yellow pixel
and RGB brightness values of 255,0,0 would produce a bright red pixel. RGB values
of 0,0,0 yield a black pixel.
Grays are produced along the gray line in the RGB color coordinate system when
equal proportions of blue, green and red are encountered
(e.g., an RGB of 127,127,127 produces a medium-gray pixel on the screen or
hard-copy device).
Jensen John R. 2005. Introductory Digital Image processing-A Remote Sensing Perspective. 3rd edition. chapter 5. Pearson Prentice Hall.
color coordinate system, which is based on additive color theory and the three
primary colors of red, green and blue. Additive color theory is based on what
happens when light is mixed, rather than when pigments are mixed using
subtractive color theory.
For example, in additive color theory a pixel having RGB
values of 255,255,255 produces a bright pixel.
Conversely, we would get a dark pigment if we mixed equally high proportions of
blue, green and red paint (subtractive color theory).
Using three 8-bit image and additive color theory, we can conceivably
display 224=16,777,216 color combinations.
For example, RGB brightness value of 255,255,0 would yield a bright yellow pixel
and RGB brightness values of 255,0,0 would produce a bright red pixel. RGB values
of 0,0,0 yield a black pixel.
Grays are produced along the gray line in the RGB color coordinate system when
equal proportions of blue, green and red are encountered
(e.g., an RGB of 127,127,127 produces a medium-gray pixel on the screen or
hard-copy device).

Jensen John R. 2005. Introductory Digital Image processing-A Remote Sensing Perspective. 3rd edition. chapter 5. Pearson Prentice Hall.
April 06, 2011
DIGITAL IMAGE DATA FORMATS
DIGITAL IMAGE DATA FORMATS
The image analyst can order digital remote sensor data in a variety of formats.
The most common formats are :
- Band Interleaved by Pixel (BIP),
- Band Interleaved by Line (BIL), and
- Band Sequential (BSQ).
To appreciate the data formats, consider a hypothetical remote sensing dataset containing
just nine pixels obtained over the interface between land and water. The Image consists
of three bands (band 1=green;band 2=red;band 3=near-infrared).
The brightness value (BVi,j,k) row, column, and band notation is provided (figure 1a).
Band Interleaved by Pixel (BIP) Format
The BIP format places the brightness values in n bands associated with each pixel in the dataset in sequential order [e.g., for a dataset containing three bands the format for the first pixel in the matrix (1,1) is 1,1,1; 1,1,2; 1,1,3]. The brightness values for pixel (1,2) are then placed in the dataset (e.g., 1,2,1; 1,2,2; and 1,2,3), and so on. An end-of-file (EOF) marker is placed at the end of the dataset (figure 1b).
Band Interleaved by Line (BIL) Format
The BIL format creates a file that places the brightness values in n bands assocciated with each line in the dataset in sequential order. For example, if are three bands in the dataset, all of the pixels in line 1, band 2, and the then line 1, band 3. An EOF marker is placed at the end of the dataset (figure 1c).
Band Sequential (BSQ) Formats
The BSQ format places all of the individual pixel values in each band in a separate and unique file. Each band has its own beginning header record and EOF marker (figure 1d).
The BSQ format places all of the individual pixel values in each band in a separate and unique file. Each band has its own beginning header record and EOF marker (figure 1d).

February 20, 2011
Merekam ArcMap Project (*.mxd) ke CD/DVD/USB Flashdisk
Jika anda ingin mengopi sebuah project ArcMap (*.mxd) ke media lain, maka anda membutuhkan script MXDPackager.
Syaratnya, semua file layer atau shp dan project diletakkan dalam satu folder. Jadi, nantinya anda hanya mengopi foldernya saja ke media lain.
MXDPackager merupakan sebuah script untuk merekam ArcMap project (*.mxd)
ke dalam USB Flashdisk/CD/DVD dan tersedia dalam format *.bas
Berikut langkah-langkahnya:
1. Extract MXDPackager. Nama file hasil extract adalah PackageMXD end.bas
2. Buka ArcMap project (*.mxd) yang ingin Anda copy ke USB Flashdisk/CD/DVD
3. Kemudian klik menu Tools - Macros - Visual Basic Editor .

4. Pada jendela Project di sebelah kiri tampilan Visual Basic Editor, klik
kanan pada Project (nama file ArcMap project.mxd), lalu pilih Import File.

5. Browse pada file PackageMXD end.bas klik Open
6 .Di bawah Project (nama file ArcMap project.mxd) kini tersedia folder
Modules dan di dalamnya terdapat PackageMXD.
7. Double klik PackageMXD, sehingga script-nya akan tampil.
lalu klik Run atau tekan F5.

8. Browse folder untuk menyimpan hasil kerja MXDPackager. Klik OK

9. Muncul jendela yang menanyakan, apakah Anda ingin menyimpan seluruh
layer (klik Yes) atau seluruh layer di clip sesuai dengan dataframenya (No)

10. Jika Anda klik Yes, akan muncul jendela kecil berikutnya yang menanyakan,
apakah Anda ingin menyimpan seluruh layer baik yang visible maupun
invisible (Yes) atau hanya yang visible saja (No)

Download MXDPackager
Syaratnya, semua file layer atau shp dan project diletakkan dalam satu folder. Jadi, nantinya anda hanya mengopi foldernya saja ke media lain.
MXDPackager merupakan sebuah script untuk merekam ArcMap project (*.mxd)
ke dalam USB Flashdisk/CD/DVD dan tersedia dalam format *.bas
Berikut langkah-langkahnya:
1. Extract MXDPackager. Nama file hasil extract adalah PackageMXD end.bas
2. Buka ArcMap project (*.mxd) yang ingin Anda copy ke USB Flashdisk/CD/DVD
3. Kemudian klik menu Tools - Macros - Visual Basic Editor .

4. Pada jendela Project di sebelah kiri tampilan Visual Basic Editor, klik
kanan pada Project (nama file ArcMap project.mxd), lalu pilih Import File.

5. Browse pada file PackageMXD end.bas klik Open
6 .Di bawah Project (nama file ArcMap project.mxd) kini tersedia folder
Modules dan di dalamnya terdapat PackageMXD.
7. Double klik PackageMXD, sehingga script-nya akan tampil.
lalu klik Run atau tekan F5.

8. Browse folder untuk menyimpan hasil kerja MXDPackager. Klik OK

9. Muncul jendela yang menanyakan, apakah Anda ingin menyimpan seluruh
layer (klik Yes) atau seluruh layer di clip sesuai dengan dataframenya (No)

10. Jika Anda klik Yes, akan muncul jendela kecil berikutnya yang menanyakan,
apakah Anda ingin menyimpan seluruh layer baik yang visible maupun
invisible (Yes) atau hanya yang visible saja (No)
Download MXDPackager
February 17, 2011
IMAGE CLASSIFICATION EXERCISE USING ILWIS 3.3
1. Open ILWIS software by double clicking the ILWIS icon on the desktop, and
you will see the following opening menu. In this opening menu, click the open
file icon, so that you can select a folder named DATA_ILWIS in C:\ drive, or any
other folder name specified by your instructor. As you can see here, there is no
file available for working.
However, actually there is an image dataset prepared for your exercise,
although it is stored in ERDAS 7.* format (*.lan)
Author by : Projo Danoedoro
download here
you will see the following opening menu. In this opening menu, click the open
file icon, so that you can select a folder named DATA_ILWIS in C:\ drive, or any
other folder name specified by your instructor. As you can see here, there is no
file available for working.
However, actually there is an image dataset prepared for your exercise,
although it is stored in ERDAS 7.* format (*.lan)
Author by : Projo Danoedoro
download here
February 13, 2011
Aligning Themes in a View
Aligning raster data with unprojected vector data in a view
If grids or images you are using have been projected in a package such as ARC/INFO,
they can be aligned with vector data in decimal degrees. Since the grid or image does not
project in ArcView, simply project the view. The unprojected vector data will project to
align with the raster data.
To align your raster and vector data :
1. Determine the projection parameters used when your image or grid was projected.
For grids, this information appears in its prj file. For images, check any available metadata
files.
2. Add the image or grid to a view. Also add the unprojected vector decimal degree data.
3. From View Properties, select Projection to display the Projection Properties dialog box.
4. Set the view’s map projection to match the parameters of the grid or image. If the
parameters of the projection do not match those of ArcView’s standard projections,
try using a custom projection. Use the table below as a guide.
5. Click OK on the Projection Properties dialog box.
6. From View Properties, set the Map Units of the view to match the projected units
of your image or grid. For example, if your image is projected to State Plane feet,
set the Map Units to feet.
7. Click OK on the View Properties dialog box. ArcView redraws the view using the
projection you chose, and your themes should align.
If grids or images you are using have been projected in a package such as ARC/INFO,
they can be aligned with vector data in decimal degrees. Since the grid or image does not
project in ArcView, simply project the view. The unprojected vector data will project to
align with the raster data.
To align your raster and vector data :
1. Determine the projection parameters used when your image or grid was projected.
For grids, this information appears in its prj file. For images, check any available metadata
files.
2. Add the image or grid to a view. Also add the unprojected vector decimal degree data.
3. From View Properties, select Projection to display the Projection Properties dialog box.
4. Set the view’s map projection to match the parameters of the grid or image. If the
parameters of the projection do not match those of ArcView’s standard projections,
try using a custom projection. Use the table below as a guide.
5. Click OK on the Projection Properties dialog box.
6. From View Properties, set the Map Units of the view to match the projected units
of your image or grid. For example, if your image is projected to State Plane feet,
set the Map Units to feet.
7. Click OK on the View Properties dialog box. ArcView redraws the view using the
projection you chose, and your themes should align.
March 28, 2010
Using the Legend Tool Extension
Using the Legend Tool Extension
The Custom Legend wizard is a new ArcView tool for designing state-of-the-art
map legends. You only need to have a layout and one or more views in your project
to use this tool. Unlike traditional ArcView you do not need to have a viewframe in
your layout to add a legend. You only need to click a point at the location where you
want the lower left corner of the legend to be located and your legend will be created
from the view you choose.
To begin using the Legend Tool, open a layout in a project in which you have at least
one view. A new "Custom Legend Tool" button should appear at the right end of the
lower tool bar. Click on this button and then click the approximate point in your layout
where you would like the lower left corner of your legend. The following graphic should
appear.
Click the Next button to advance to Step 1
The Custom Legend wizard is a new ArcView tool for designing state-of-the-art
map legends. You only need to have a layout and one or more views in your project
to use this tool. Unlike traditional ArcView you do not need to have a viewframe in
your layout to add a legend. You only need to click a point at the location where you
want the lower left corner of the legend to be located and your legend will be created
from the view you choose.
To begin using the Legend Tool, open a layout in a project in which you have at least
one view. A new "Custom Legend Tool" button should appear at the right end of the
lower tool bar. Click on this button and then click the approximate point in your layout
where you would like the lower left corner of your legend. The following graphic should
appear.
Click the Next button to advance to Step 1
February 16, 2010
Konversi shp ke gdb Menggunakan Global Mapper
Konversi shp ke gdb Menggunakan Global Mapper
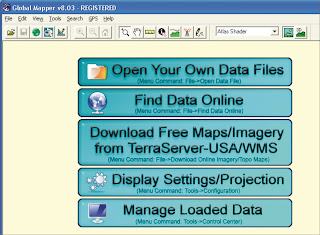
1. Buka program Global Mapper. Klik tombol Open Your Own Data Files
atau dari menu command : File > Open Data File
2. Pilih data shp anda yang berbentuk line or polyline
3. Select projection, Zone, Datum and Planar Units yang ingin anda gunakan
lalu tekan OK
1. Buka program Global Mapper. Klik tombol Open Your Own Data Files
atau dari menu command : File > Open Data File

2. Pilih data shp anda yang berbentuk line or polyline
3. Select projection, Zone, Datum and Planar Units yang ingin anda gunakan
lalu tekan OK
February 09, 2010
ArcSDE
ArcSDE
ArcSDE is the GIS gateway to relational databases. It allows you
to manage geographic information in your chosen DBMS and serve
your data openly to the ArcGIS Desktop and other applications.
ArcSDE is a key component in a multiuser ArcGIS system. It
provides an open interface to relational database management systems
and allows ArcGIS to manage geographic information on a variety
of different database platforms including Oracle, Microsoft SQL Server,
IBM® DB2®, and Informix®.
ArcSDE acts as the gateway between the rest of ArcGIS and your
relational database. When you need a very large, multiuser database
that can be edited and used simultaneously by many users, ArcSDE
adds the necessary capabilities to your ArcGIS system by enabling you
to manage your shared, multiuser geodatabase in a DBMS. It does this
by adding a host of fundamental GIS capabilities.
ArcSDE allows you to:
• Manage and maintain your geodatabase in the DBMS that you select.
• Have multiple users edit and maintain the geodatabase. ArcSDE
provides long transaction and version support for your DBMS.
• Serve multiple ArcGIS users anywhere on your network.
Centralizing your DBMS server significantly enhances performance
for large multiuser systems.
• Open your ArcGIS geodatabase to other users who use MapObjects®,
ArcView GIS 3, and computer-aided design (CAD) applications.
• Build Open GIS Consortium (OGC)-compliant applications that work
with features in your geodatabase.
• Build SQL applications that work with the tables and rows in the geodatabase.

ArcSDE is the GIS gateway to relational databases. It allows you
to manage geographic information in your chosen DBMS and serve
your data openly to the ArcGIS Desktop and other applications.
ArcSDE is a key component in a multiuser ArcGIS system. It
provides an open interface to relational database management systems
and allows ArcGIS to manage geographic information on a variety
of different database platforms including Oracle, Microsoft SQL Server,
IBM® DB2®, and Informix®.
ArcSDE acts as the gateway between the rest of ArcGIS and your
relational database. When you need a very large, multiuser database
that can be edited and used simultaneously by many users, ArcSDE
adds the necessary capabilities to your ArcGIS system by enabling you
to manage your shared, multiuser geodatabase in a DBMS. It does this
by adding a host of fundamental GIS capabilities.
ArcSDE allows you to:
• Manage and maintain your geodatabase in the DBMS that you select.
• Have multiple users edit and maintain the geodatabase. ArcSDE
provides long transaction and version support for your DBMS.
• Serve multiple ArcGIS users anywhere on your network.
Centralizing your DBMS server significantly enhances performance
for large multiuser systems.
• Open your ArcGIS geodatabase to other users who use MapObjects®,
ArcView GIS 3, and computer-aided design (CAD) applications.
• Build Open GIS Consortium (OGC)-compliant applications that work
with features in your geodatabase.
• Build SQL applications that work with the tables and rows in the geodatabase.

January 26, 2010
ArcView, ArcEditor, and ArcInfo Different
ArcView, ArcEditor, and ArcInfo Different
The ArcGIS Desktop can be accessed using three software products,
each providing a higher level of functionality. ArcView provides
comprehensive mapping and analysis tools along with simple editing and
geoprocessing tools. ArcEditor includes the full functionality of ArcView
with the addition of advanced editing capabilities for coverages and
geodatabases. ArcInfo extends the functionality of both to include
advanced geoprocessing. It also includes the legacy applications for
ArcInfo Workstation (Arc, ARCPLOT™, ARCEDIT™, and so on).

The ArcGIS Desktop can be accessed using three software products,
each providing a higher level of functionality. ArcView provides
comprehensive mapping and analysis tools along with simple editing and
geoprocessing tools. ArcEditor includes the full functionality of ArcView
with the addition of advanced editing capabilities for coverages and
geodatabases. ArcInfo extends the functionality of both to include
advanced geoprocessing. It also includes the legacy applications for
ArcInfo Workstation (Arc, ARCPLOT™, ARCEDIT™, and so on).

January 19, 2010
Transformasi Datum dari UTM ke LATLONG
Transformasi Datum dari UTM ke LATLONG
Transformasi datum di ArcView yang menggunakan extension Projection Utility Wizard
hanya dapat dipakai untuk shapefile tipe polygon dan line.
Untuk tipe point di ArcMap, kita dapat menggunakan
Toolbox Data Management Tools > Projections and Transformation.
1. Buka ArcMap. Klik ikon Show/Hide Arc Toolbox >
Data Management Tool > Projections and Transformations

2. Lalu double klik Define Projection. Masukkan data yang tipenya point,
seperti koordinat desa, kota atau lainnya. Tentukan sistem koordinatnya. OK

3. Pada layer akan muncul data layernya dan menggunakan koordinat
UTM (lihat tanda panah merah)
Transformasi datum di ArcView yang menggunakan extension Projection Utility Wizard
hanya dapat dipakai untuk shapefile tipe polygon dan line.
Untuk tipe point di ArcMap, kita dapat menggunakan
Toolbox Data Management Tools > Projections and Transformation.
1. Buka ArcMap. Klik ikon Show/Hide Arc Toolbox >
Data Management Tool > Projections and Transformations

2. Lalu double klik Define Projection. Masukkan data yang tipenya point,
seperti koordinat desa, kota atau lainnya. Tentukan sistem koordinatnya. OK

3. Pada layer akan muncul data layernya dan menggunakan koordinat
UTM (lihat tanda panah merah)


